Making a Chart using Intersystems IRIS + Python
How to use the IRIS Native API in Python to access globals and plot some charts.
Why Python?
With a large adoption and use in the world, Python have a great community and a lot of accelerators | libraries to deploy any kind of application.
If you are curious (https://www.python.org/about/apps/)
Why COVID-19 Data
As the pandemy evolves in the world a lot of information are being spreaded so I decided to create an application to audit those information.
Unfortunately each country has a different test policy so I decided to use the death data to avoid the cases subnotifications.
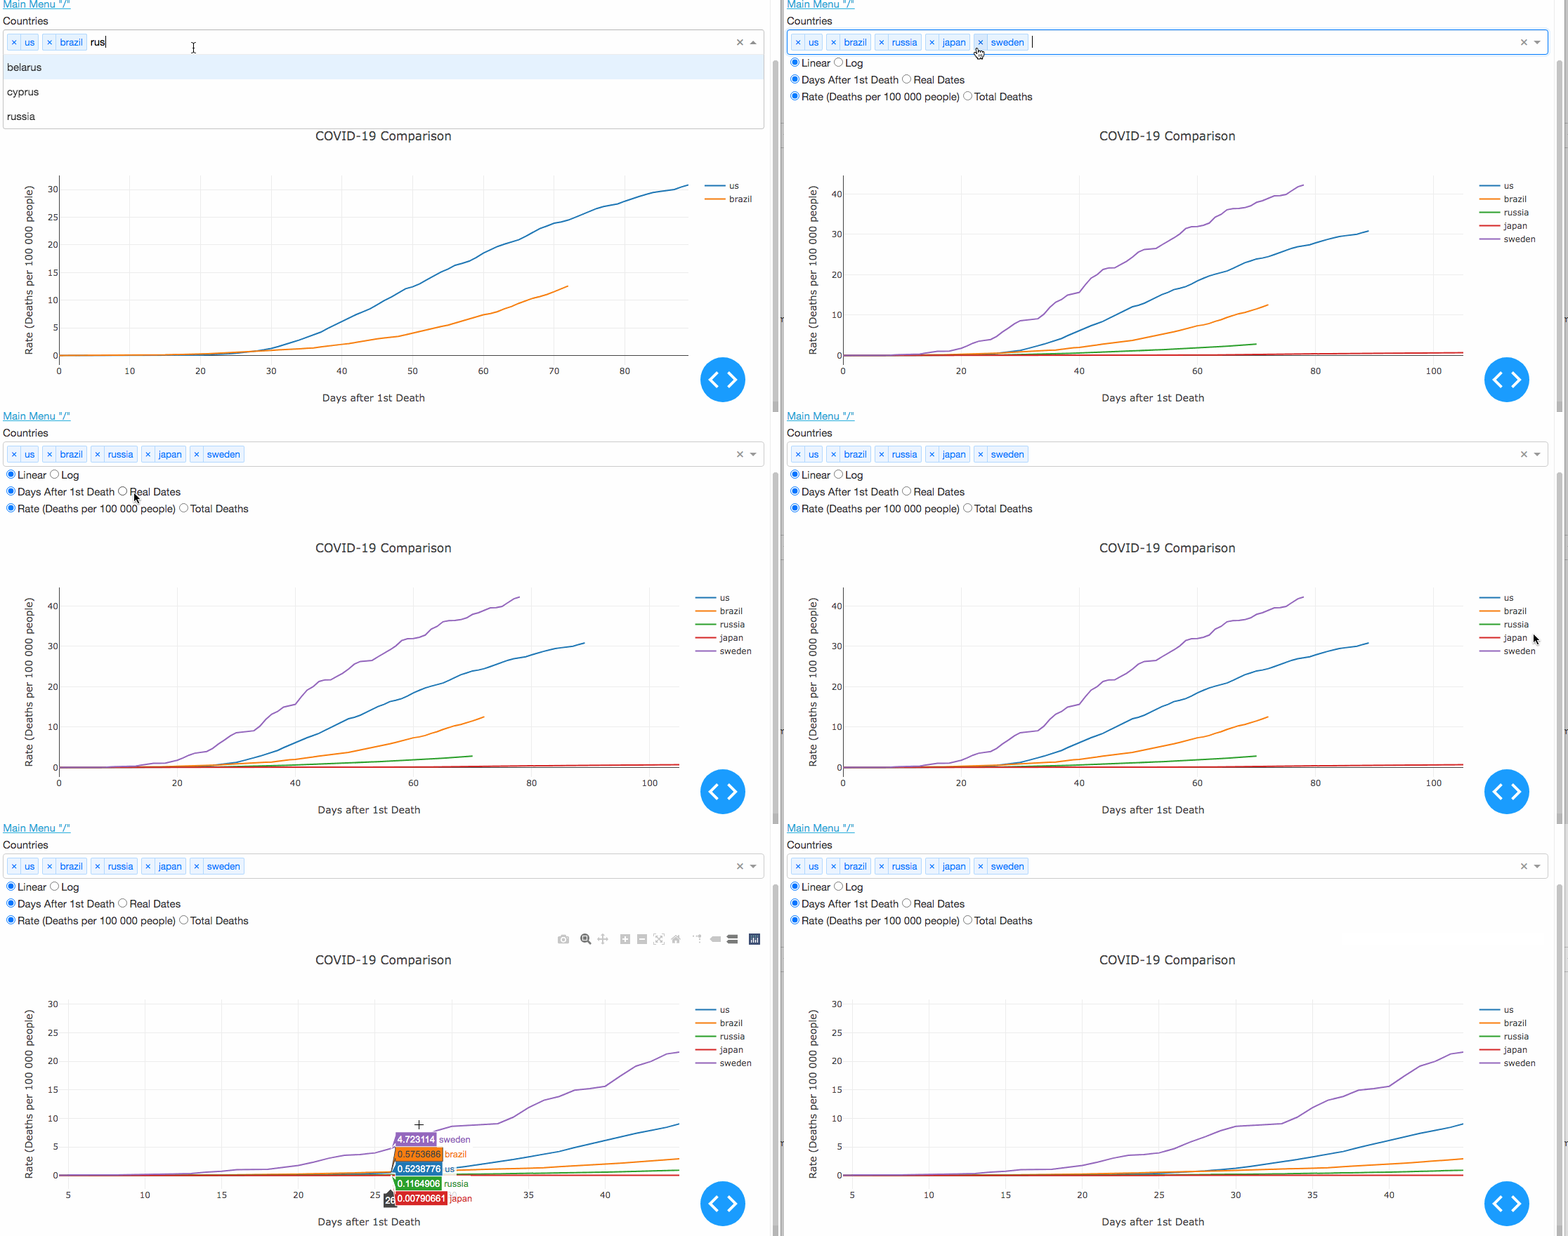
Chart options:
- Linear: Using linear y axis
- Log: Using a logathmic y axis as the infection grows exponentially
- Days after the first death: Align all 1st deaths country in the same time series
- Real Timeline: With the real date of each report
- Rate: Consider the population of the country
- Total Deaths: Consider just the number of deaths
The Chart Application

Demo - Try it yourself
I have deployed the application as a demo here:
(http://iris-python-suite.eastus.cloudapp.azure.com/covid19-chart)
Take a look the code
Clone my repository to see all the code implementation.
git clone https://github.com/renatobanzai/iris-python-covid19.git
What did I use in Python
In this application environment I use Python 3.7 with these modules.
- PyYAML==5.3.1
- dash==1.12.0
- plotly==4.7.1
- irisnative-1.0.0-cp34-abi3-linux_x86_64.whl
Project Structure
This project has a simple structure to be easy to understand. On the main folder we have 3 most important subfolders:
- ./app: with all the application code and installing configuration.
- ./iris: with the InterSystems IRIS dockerfile preparing to serve the application.
- ./data: with the files from Johns Hopkins University to ingest and a YAML to change configuration outside the container environment by a volume
Application Structure
Now inside the ./app directory we can see some files:
__main__.py : with the implementation of the web application- iriscovid19.py : a class performing all data interaction
Database Structure
This application uses Intersystems IRIS as a repository, the globals used are:
-^config : with some config data
-^raw.covid19 : where the raw data (Source of Data) are ingested
-^countrydetails : to get the population of each country
-^end.date.deaths : to serve the chart requisitions and here is the goal, Its fast!
-^end.timeless.deaths : to server another kind of chart requisition
What the python code does?
The python get the csv files from ../data folder and ingest into the globals ^raw.covid19, ^countrydetails. After this
perform a data prep using the globals and generating a ready to use data to plot the charts. After this a web app goes
up to you interact with the graph as you desire.
How to perform joins between globals?
The paradigm in this case is quite different from the SQL Patterns. To perform joins, I ingested the data in a format
that can be used as a index to merge the globals. e.g:
#{country_index} is only an example
^raw.covid19("countries","{country_index}","deaths")
^countrydetails("{country_index}","population")
If for some reason you need to use the population of a country its prepared to get with one .get() method.
Running the application by yourself
Prerequisites
- git
- docker and docker-compose
- acess to a terminal in your environment
Steps
With docker-compose you can easily up one environment with all the pieces and configurations go to the iris-python-covid19
folder and type this:
$ docker compose up
Estimated time to up containers
1st time running will depend of your internet link to download the images and dependencies.
If it last more than 15 minutes probably something goes wrong feel free to communicate here.
After the 1st time running the next ones will perform better and take less then 2 minutes.
If is everything ok
After a while you can open your browser and go to the address:
http://localhost:8050
Main Menu
The project has a main menu that points you to the functionalities:
- COVID-19 Chart Example "/covid19-chart": A interactive chart using globals + Python
- Global CRUD Example "/config-CRUD": A demonstration of a Globals CRUD
- Reset Data (Dont Panic!) "/reset-data": If you want to re-perform the start-up applications process
You should look at IRIS Admin Portal
I'm using for now the USER namespace
http://localhost:9092
user: _SYSTEM
pass: theansweris42
Demo
I deployed this application on (http://iris-python-suite.eastus.cloudapp.azure.com/covid19-chart)http://iris-python-suite.eastus.cloudapp.azure.com/covid19-chart
If this article help you or you like the content vote:
This application is at the current contest on open exchange, you can vote in my application iris-python-suite here(https://openexchange.intersystems.com/contest/current)

Great article!
Very well detailed
I am looking forward to creating something using the python suite as a reference.